See the shape of your data
Analyze a sample of documents for fields, types and how often each one appears, then draw the whole database as an ER diagram with relationships MotionQL infers and checks for you.
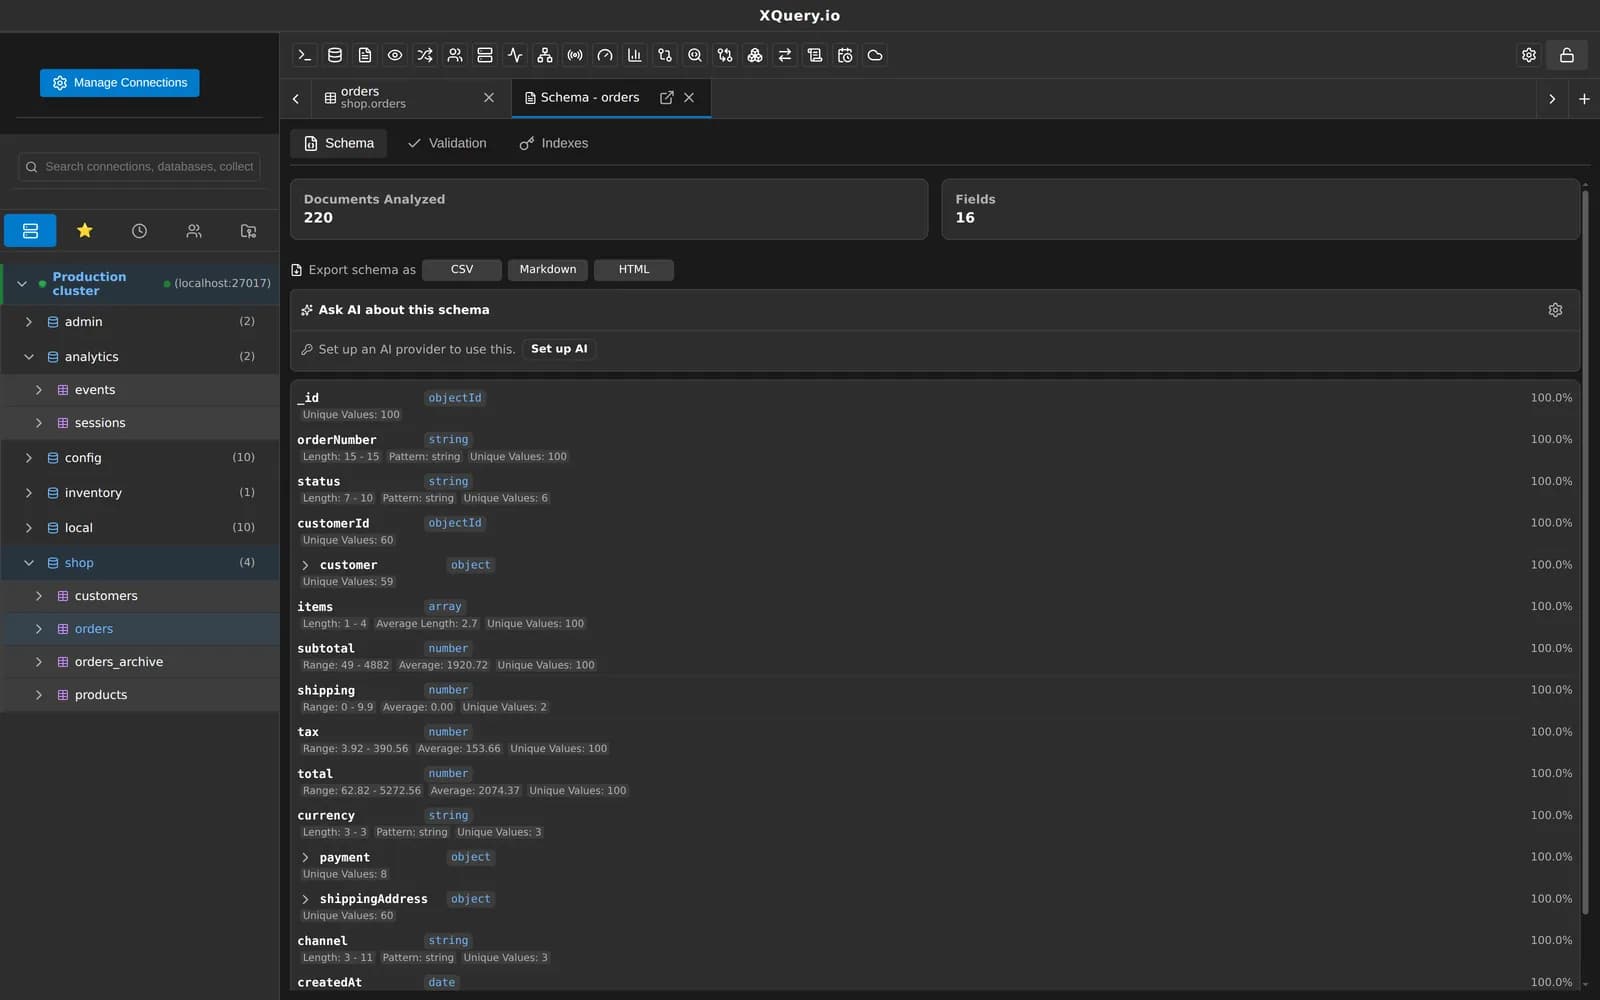
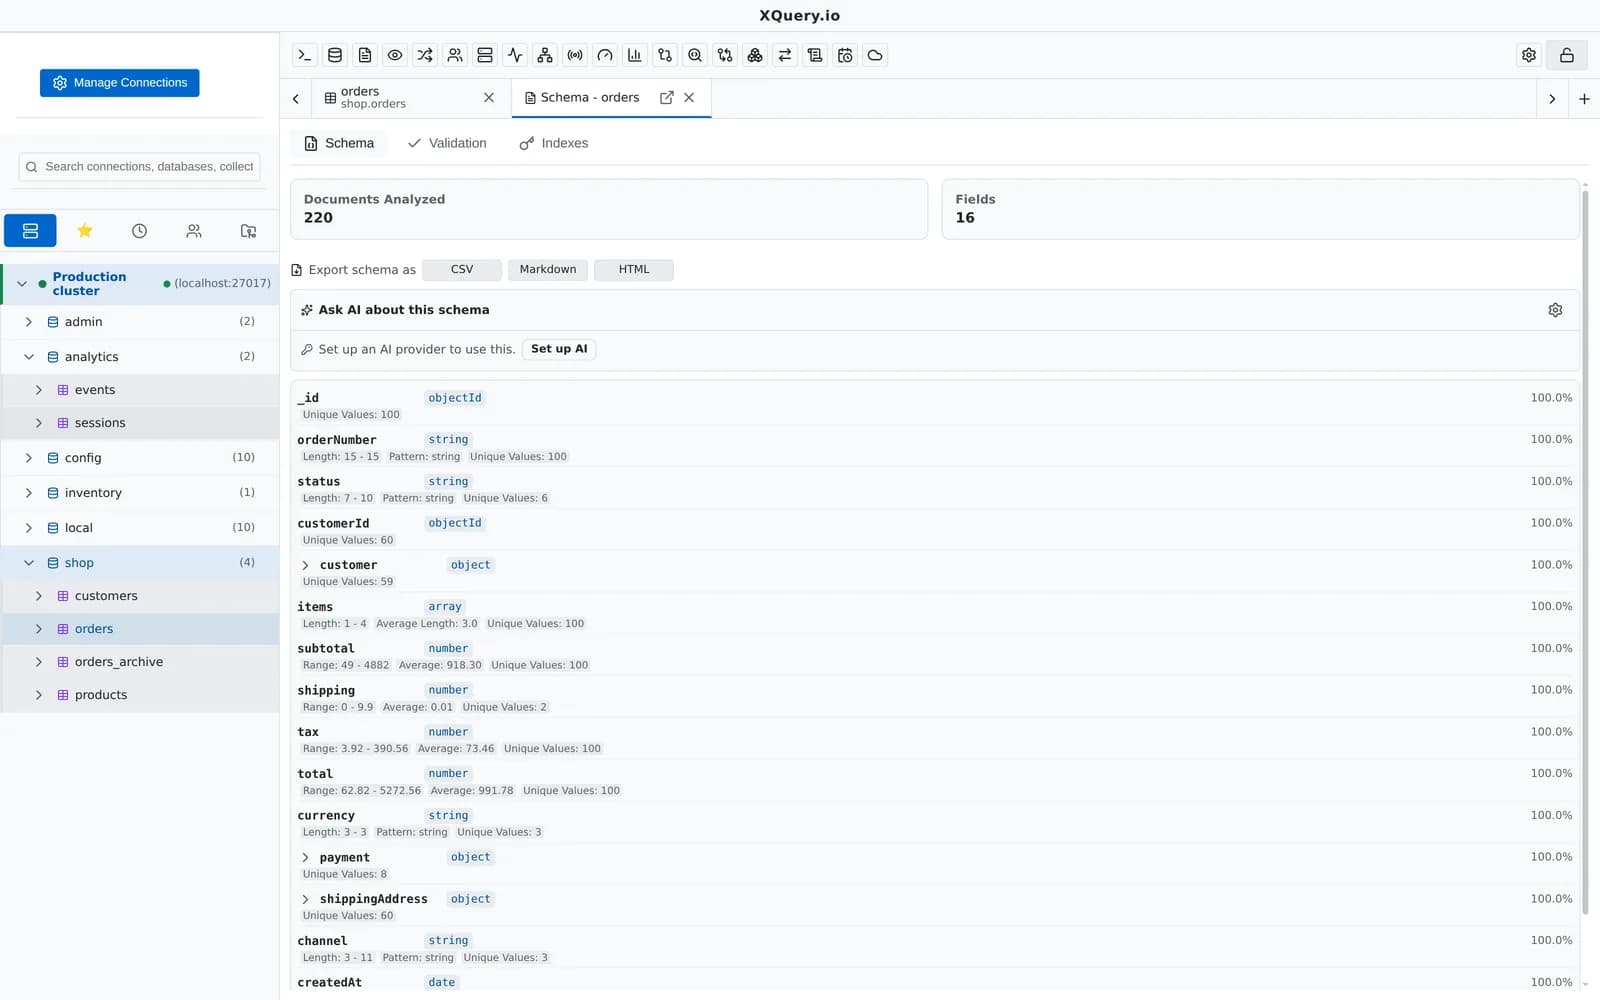
Fields, types, frequencies and value statistics from a sample.
What you can do with it
Schema analysis
Fields, types, frequencies and value statistics, exported as CSV, Markdown or HTML.
ER diagram of a database
Every collection with its fields, PK / FK keys, types, required fields and how often each field appears.
Relationships found for you
From field names (customerId → customers, items[].productId → products), DBRefs and views, each checked against sampled values. Match by value finds links with no name hint.
Edit the model
Drag collections, add or remove relationships, change cardinality, hide collections and write notes. Layout and edits are kept per database.
Follow a relationship
Open any relationship as a $lookup in the aggregation editor.
Export
PNG or SVG images, a Mermaid erDiagram, or the diagram as JSON you can open again.
Validation rules
Generate a $jsonSchema validator from the analyzed fields and edit validation level and action.
Values stay put
Only names, types and match counts leave the connection; document values never reach the diagram.
Related features
Your next query deserves a better IDE.
Create a free account, download MotionQL, and paste your Pro key. You'll be querying in under two minutes.