InfluxDB in Flux, InfluxQL or SQL
A query console with a time-range picker and charts, a data explorer that writes the query for you, line protocol checks before writing, and a health panel with cardinality.
- InfluxDB 2.x
- InfluxDB 3 Core and Enterprise
- InfluxDB Cloud (checked with mocks only)
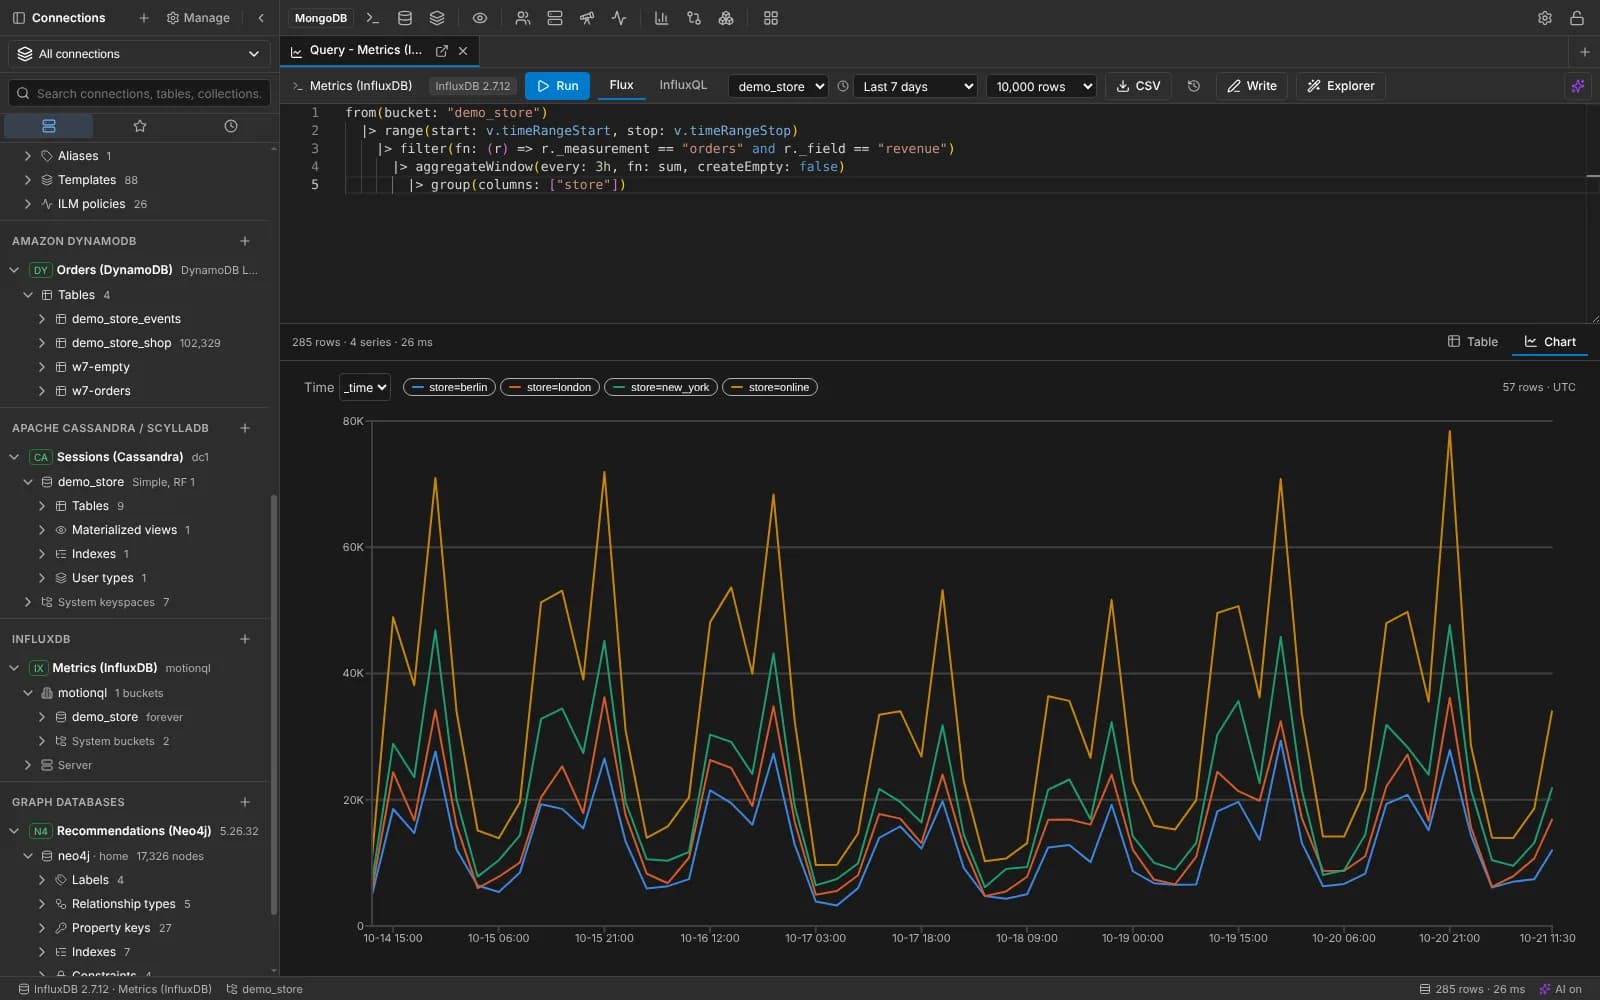
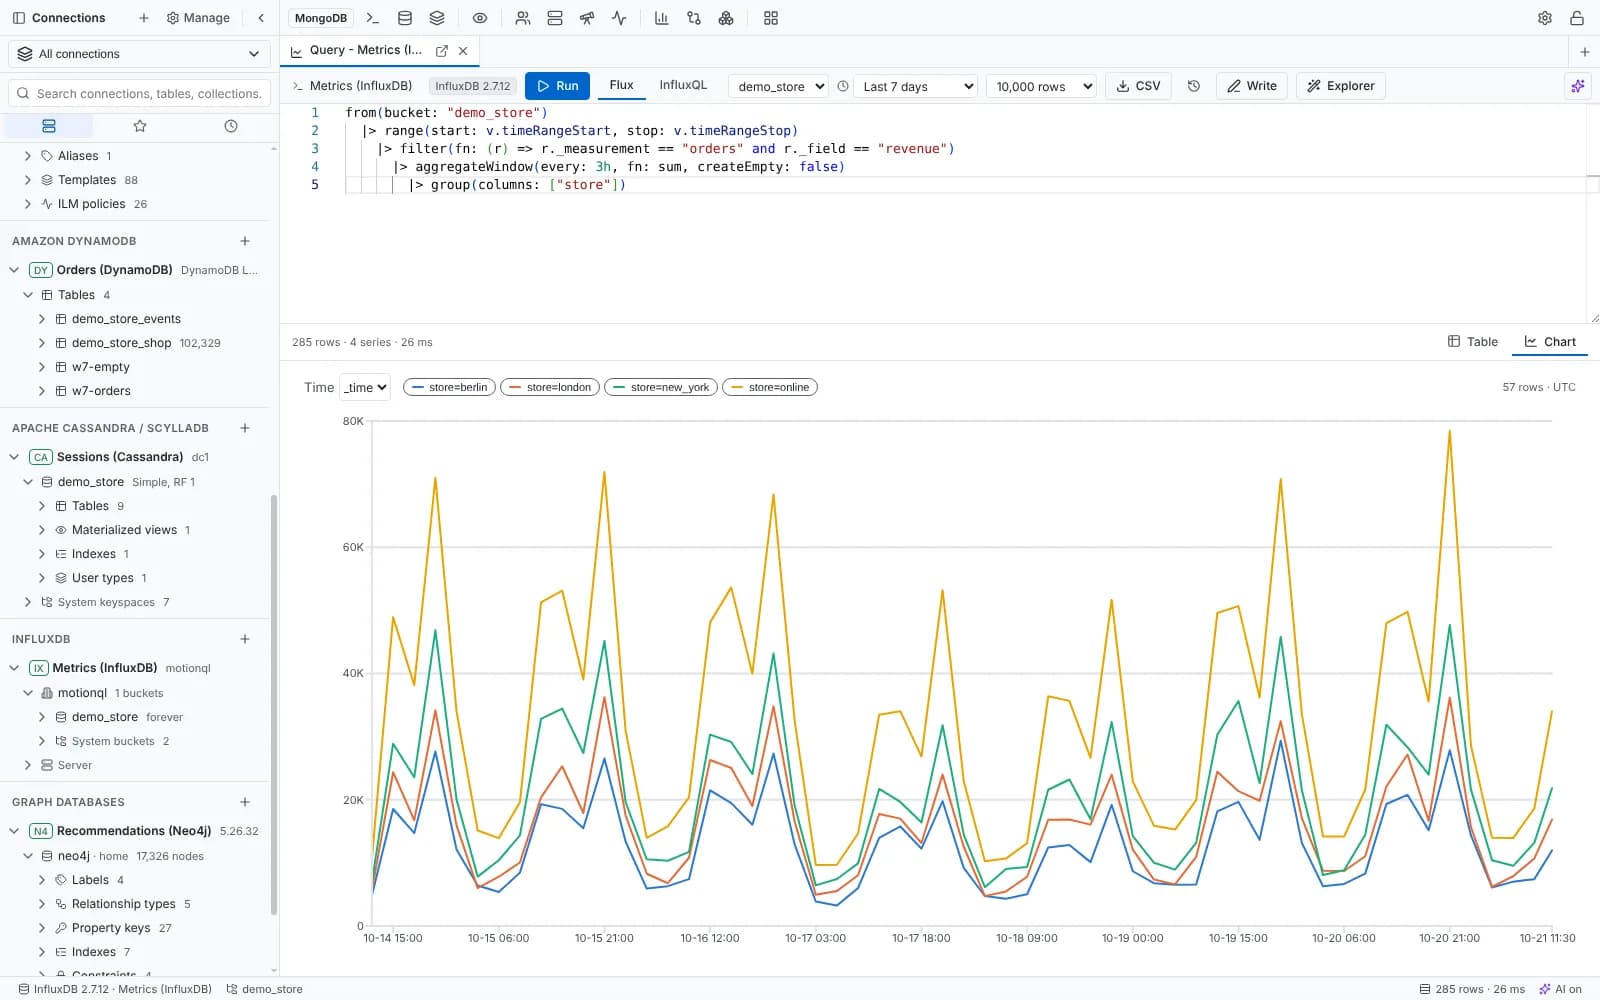
An InfluxDB query charted over the selected time range.
What you get for InfluxDB
Three languages, one console
Flux, InfluxQL or SQL with highlighting and completion, a time-range picker, table and chart views, and CSV export.
Data explorer
Pick a bucket, measurement, fields, tag filters, window and aggregate, and see the Flux, InfluxQL or SQL as you go.
Write safely
Write line protocol checks the lines and previews the points and field types first. Delete by predicate needs the bucket name typed.
Health and cardinality
Health and readiness, series and tag cardinality, tasks with their runs and logs, and on InfluxDB 3 the recent queries.
- InfluxDB Cloud is offered but untested against a live account.
And everything every connection gets
Each database keeps its own tools, and shares one workspace with the others.
- Projects with Development, Staging and Production environments, enforced on every write
- Logs & analytics: the server's log, slow operations by shape and live metrics
- An AI assistant that writes and fixes this family's queries, with your own key
- Read-only connections, typed confirmations and a local audit log
- Saved queries as files in a folder you can put in Git
- Notebooks and charts on live results
Also in search, time series and graph: Elasticsearch and OpenSearch, Neo4j and Memgraph.
Your next query deserves a better IDE.
Create a free account, download MotionQL, and paste your Pro key. You'll be querying in under two minutes.